
Prometheus & Grafana
On Unikraft Cloud (UKC), it’s possible to use the platform’s metrics API to export instance metrics in different formats, including Prometheus. In this guide we show you how to quickly set this up.
Prometheus Integration
To use the Unikraft Cloud metrics API we’ll assume you already have at least one instance running (e.g., you can follow the nginx guide).
First, we’ll need to retrieve the instance’s uuid, which we can do with the kraft cloud inst get command.
For example, assuming the instance’s name is nginx-y6587:
➜ kraft cloud inst get nginx-h86j5 uuid: d1e6253e-16fa-4f91-8433-93122506b5b7 name: nginx-y6587...We can then query the metrics API to get the metrics for the instance in the prometheus format:
curl -X GET \ -H "Authorization: Bearer ${UKC_TOKEN}" \ "https://api.${UKC_METRO}.kraft.cloud/v1/instances/d1e6253e-16fa-4f91-8433-93122506b5b7/metrics"# HELP Resident set size in bytes# TYPE instance_rss_bytes gaugeinstance_rss_bytes{instance_uuid="d1e6253e-16fa-4f91-8433-93122506b5b7"} 34566144
# HELP Consumed CPU time in milliseconds# TYPE instance_cpu_time_milliseconds counterinstance_cpu_time_milliseconds{instance_uuid="d1e6253e-16fa-4f91-8433-93122506b5b7"} 680
# HELP Amount of bytes received over network# TYPE instance_rx_bytes counterinstance_rx_bytes{instance_uuid="d1e6253e-16fa-4f91-8433-93122506b5b7"} 42
# HELP Amount of bytes transmitted over network# TYPE instance_tx_bytes counterinstance_tx_bytes{instance_uuid="d1e6253e-16fa-4f91-8433-93122506b5b7"} 2060
# HELP Count of packets received from network# TYPE instance_rx_packets counterinstance_rx_packets{instance_uuid="d1e6253e-16fa-4f91-8433-93122506b5b7"} 1
# HELP Count of packets transmitted over network# TYPE instance_tx_packets counterinstance_tx_packets{instance_uuid="d1e6253e-16fa-4f91-8433-93122506b5b7"} 8Next, let’s start a simple Prometheus server and add the instance as a target. For this step you’ll need to make sure that your Unikraft Cloud token is available to Prometheus via a file, for example:
echo -n "${UKC_TOKEN}" > /tmp/ukc_token.txtLet’s start the server:
docker run \ -p 9090:9090 \ -v /tmp/ukc_token.txt:/ukc_token.txt \ -v /tmp/prometheus.yml:/etc/prometheus/prometheus.yml \ prom/prometheusWith this in place, let’s configure our Prometheus configuration file;
we’ll use port 9090 for this and job name myinstance:
global:  scrape_interval: 15s  evaluation_interval: 15s
scrape_configs:  - job_name: prometheus    static_configs:      - targets: ["localhost:9090"]
  - job_name: myinstance    scheme: https    metrics_path: "/v1/instances/<your_instance_uuid>/metrics"
    authorization:      credentials_file: "/ukc_token.txt"
    static_configs:      - targets: ["api.fra0.kraft.cloud"]
You should be able to see that the instance is UP in the Prometheus UI: http://localhost:9090/targets?search=myinstance
This means we can now do queries directly in Prometheus: http://localhost:9090/graph?g0.expr=instance_cpu_time_milliseconds&g0.tab=0&g0.display_mode=lines&g0.show_exemplars=0&g0.range_input=1h
Grafana Integration
We can also use Grafana to visualize the metrics. First, let’s start a Grafana server and add Prometheus as a data source:
docker run \ -p 3000:3000 \ grafana/grafanaTo get the IP of the prometheus server in docker, you can use the following commands:
docker container list # to get the container iddocker inspect -f '{{range.NetworkSettings.Networks}}{{.IPAddress}}{{end}}' <prometheus container id>After this, log in with the default credentials: admin and admin.
Now let’s add the newly started Prometheus server as a data source by creating a new Prometheus data source: http://localhost:3000/connections/datasources/new
Next, under Connection, set the Prometheus server URL: http://192.168.0.1XX:9090.
We need to set the IP/FQDN to it, as localhost will not work (we’re inside a container).
When saving it, it will tell us that the connection is working; you should now see the data on the Grafana board, as an example:
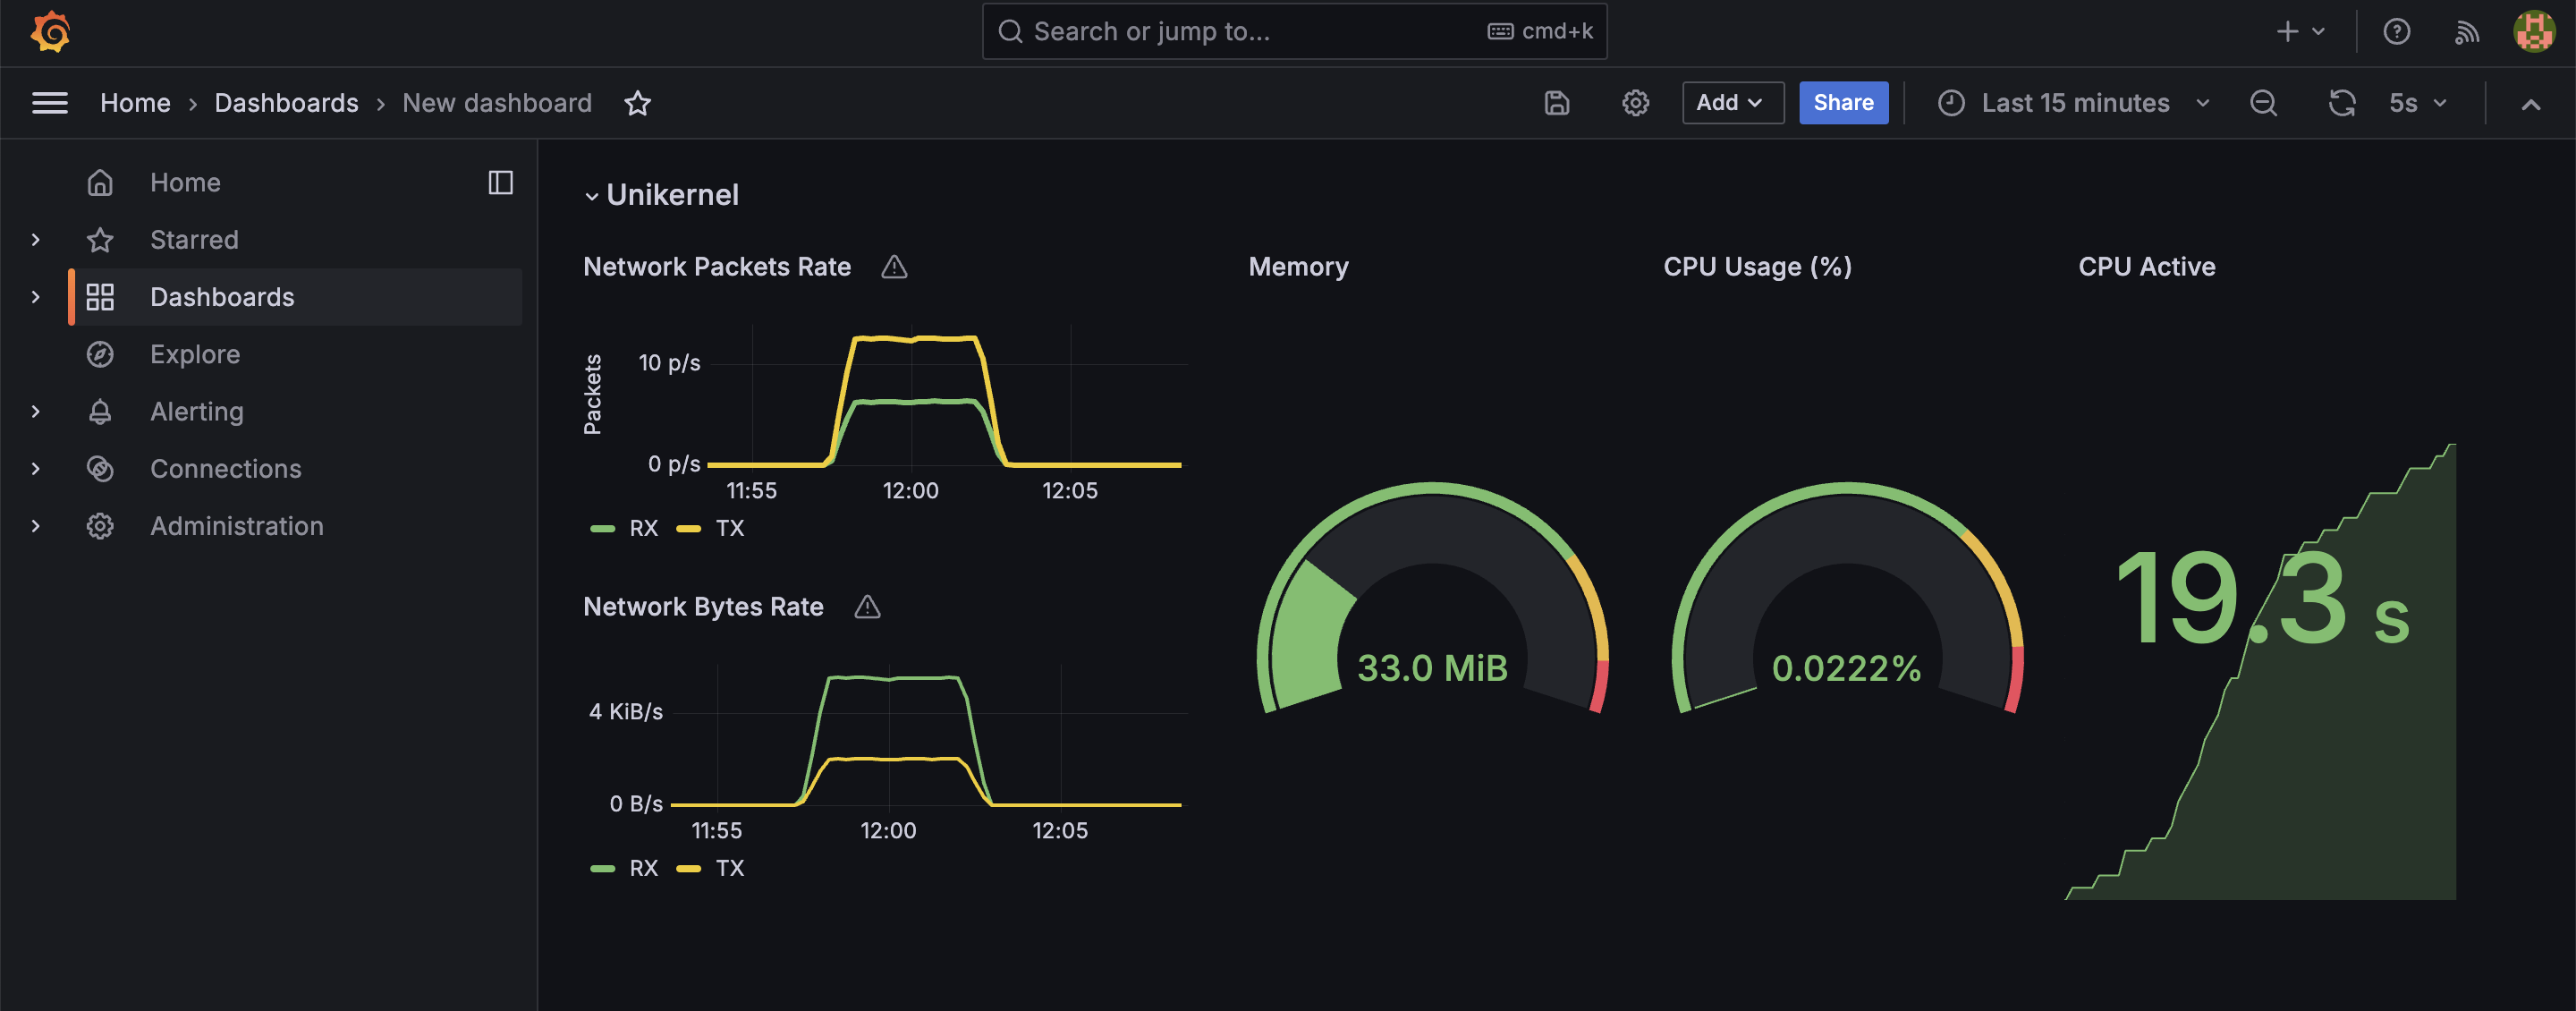
To customize the dashboard please consult the Grafana documentation.
Learn More
- The Unikraft Cloud metrics API
- The Grafana documentation